Scintillocartography
(This article is the result of my participation in the “Nuclear Sessions” workshop hosted by Madrid’s Medialab. It is explicitly published under a CC-by-sa 4.0 license.)
The tricky thing about ionizing radiation is that it cannot be seen by the naked eye; it cannot be heard, or felt by human senses. We can only sense it through indirect means.
The method that arguably has permeated the most into popular culture is the Geiger counter. Its main component, the Geiger-Müller tube is filled with an ionized noble gas; whenever radiation in the form of a gamma particle hits the gas, it produces a phenomenon known as an electron avalanche that produces a strong electrical pulse. If that electrical pulse is fed to an audio loudspeaker, it will produce a characteristic crackling sound.
Thus, the sound of a Geiger counter is not the sound of radiation, but of an indirect process of interactions between purposefully-made components: it’s the sound of a loudspeaker being fed an electric pulse produced by an electron avalanche born in an encapsulated and ionized gas.
Our human brains are usually not interested in the inner workings of such a piece of machinery; instead we want a reliable tool with a clear cause-effect correlation: when gamma radiation comes in, a noise comes out. We ignore the inner workings because the work of engineers has been precisely to abstract and obscure the (usually uninteresting) inner workings.
Most methods of detecting and measuring ionizing radiation are likewise indirect: radiation hits A, which affects B, which in turn affects C, which affects D, which affects something that can be finally perceived by human senses.
The artistic process of deconstruction, which has been commonly used to interpret a subject, or to analyze where a meaning comes from and how it behaves, cannot be applied to nuclear radioactivity. It either requires complex tools, which defy the deconstruction itself, or deadly amounts of radioactive material, which would obviously be incredibly dangerous. No scientist in their sane mind would expose themselves to the amounts of radioactive material as the pioneers of the early 20th century did to themselves; even among the flat-earthers and the vaccine deniers one cannot find a single person who thinks that licking enriched uranium is safe, or that there’s a global conspiracy just to prevent the use of thorium to cure headaches. The written reports of illness and death from the first decades of the 20th century have ensured so.
Observing the direct effects of radiation, although possible, requires extraordinary circumstances.
One of those circumstances is being close to a nuclear reactor submerged in water, which allows Cherenkov radiation to be observed. In layman’s terms: gamma radiation exits the reactor at the speed of light in a vaccuum, but the speed of light in water is lower, and photons have to slow down somehow. The direct, observable effect is that water glows blue.
This blue glow has barely entered popular culture. The only two examples I’m aware of are the cinematographic depictions of the Chernobyl disaster, and the ficticious Nuka-Cola Quantum non-alcoholic beverage in the Fallout videogame series.
Amazingly enough, most other depictions of radioactive glow are either green (in the materials, to denote toxicity) or orange (in the reactors, to denote warmth). Nuclear power is so alien that it even defies the semantics of colours.
The other extraordinary circumstance that allows observing radiation in a direct way is being outside of the earth’s magnetosphere. Astronauts travelling to (and from) the moon have reported a phenomenon called either Astronaut’s eye, light flashes or cosmic ray visual phenomena.
This phenomenon is not fully understood due to the very limited amount of occurences, but the scientific consensus is that cosmic radiation hits the astronaut’s eyes (either the vitreous humour, the retina, or the optic nerve), which translates in the person “seeing” (mostly) white dots, (sometimes) white lines, and (rarely) clouds or blobs.
I am most interested in this phenomenon, since it is one of the few observations of radiation that humans can experience directly, and also has parallels to some indirect means of observation used. This sudden appearance and dissipation of white dots is called scintillation (from the latin scintillāre meaning “to sparkle, glitter, gleam, flash”); and there even exists an entire branch of nuclear physics named scintillography, which studies how to record radiation by means of observing the sparkles that it leaves behind.
This notion of radiation as its sparkly record, I argue, can be commonly understood by the scientifically inclined. After all, the shape of atoms - in particular, the Rutherford model - is taught as part of high-school physics, as is Rutherford’s gold-foil experiment. We know that a controlled radioactive source will imprint white dots on a photographic plate, or on a phosphorescent material. If we have ever listened to a Geiger counter, we can also imagine the random cadence at which those dots are imprinted.
Perhaps this analogy will be lost in the future. We live in an era where cathode-ray tubes (those in televisions or scientific equipment such as oscilloscopes) are but a museum piece, and the generation of people who operated computers by staring at green phosphor screens is growing old. Back in the 1980s, everybody knew that shutting down a television would leave a lingering white line, then a lingering white dot at its center, a symbol of what happens when the human mechanisms of controlling rays of energy fail expectedly.
Analogies to the behaviour of human-made contraptions have failed in the past. Reminisce, if you will, about «the color of a television turned to a dead channel» in William Gibson’s “Neuromancer” novel, or «the sounds of giant aircraft warming up at the ends of their runways» in J. G. Ballard’s post-nuclear wasteland. Televisions have gone from silvery noise to blue to black to psychedelic swirls, and planes have gone from propeller blades to turboprops to ramjets to turbojets to turbofans to scramjets. How many people remember the sound of the Concorde’s hypersonic afterburners revving up? How many people remember how connecting to the internet sounded like in the 1990s?
It can be argued that we have already passed the peak point of history when the social imaginary most correlated scintillation with radiation. I will say that the peak was somewhen between the nuclear utopianism years of 1950 and 1951, when the Gilbert U-237 Atomic Energy Laboratory, a children’s educational toy, was in the shelves of toy stores. It notably included a cloud chamber: an apparatus where alcohol vapour momentarily condenses, forming little cloud trails that sparkle into existence.
Cloud chambers seem to be a thing of the past. One can ask to see the array of gamma detectors at a civil radiology laboratory, but there are no cloud chambers to be seen. And, alas, I discovered a bit too late that the CERN (Conseil Européen pour la Recherche Nucléaire) provides instructions on how to build your own, with pharmacy-grade isopropyl alcohol and frozen carbon dioxide (AKA “dry ice”):
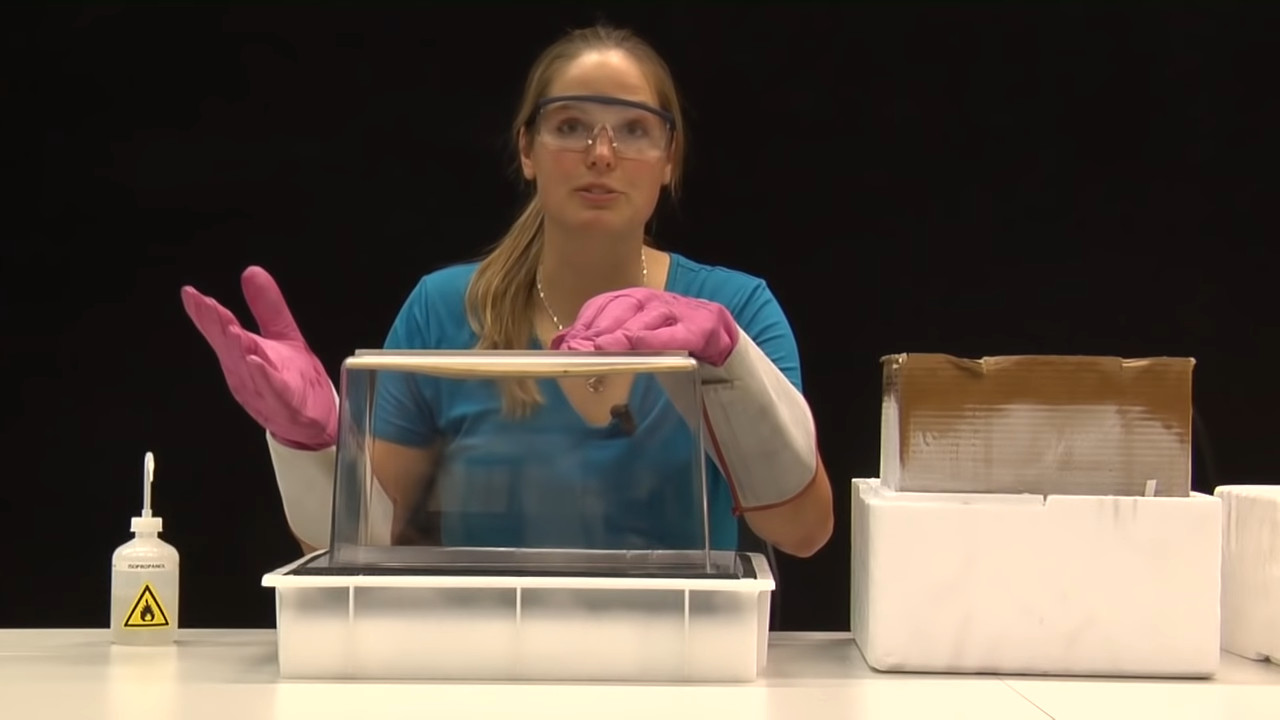
(Still image crom CERN’s video: LHC communicator Sarah Charley explains how to make a cloud chamber)
A cloud chamber, even though it’s still an indirect method of observation, replaces the artificial shell of a Geiger counter’s plastic casing, and the thick lead walls of a gamma counter, with a pane of glass. While still a human-made construct, it is a rawer observation, unencumbered by inscrutable electronic components.
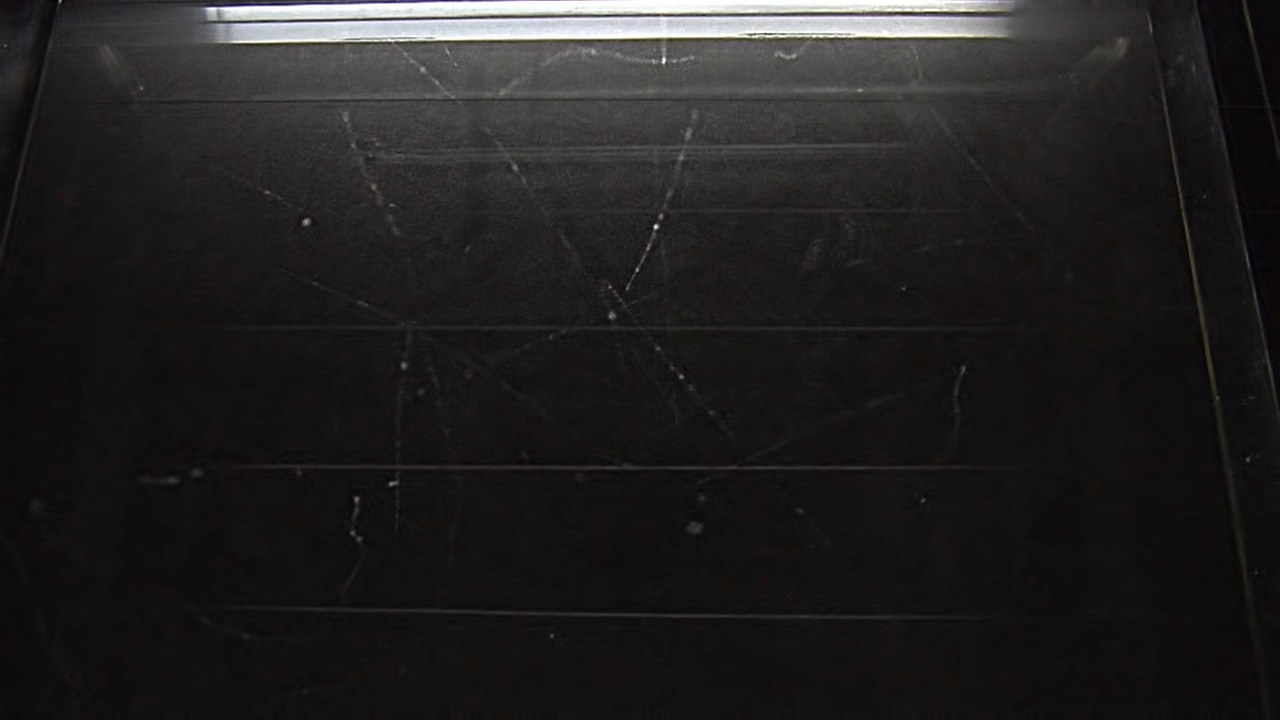
(Still image crom CERN’s video: Cloud chamber showing vapour trails of radiation)
I believe that graphical scintillation is an appropriate way of conveying radioactivity. I might be wrong, and it might become obsolete, but that won’t prevent me from, at least, trying.
The core of my professional experience lies at the conjuction of cartography, website development, and computer graphics. I tell computers how to draw maps, within the handicap of a web browser, while trying to squeeze the most out of a graphics card. For the last few years I’ve been working on a software library called Gleo; one of its goals, perhaps one too pretentious, is to update the variables available to graphic semiology.
Graphic semiology in maps has remained mostly unchanged since French cartographer Jacques Bertin published Sémiologie Graphique in 1967. Cartography works with six variables: size, value, texture, colour, orientation and shape. But a map on a computer screen differs from a map on paper (among other things) in that it can change with time, i.e. it can include an animation; DiBiase et al published Animation and the Role of Map Design in Scientific Visualization in 1992 arguing that computer graphics allow for more variables: duration, rate of change, order; and after MacEarchen’s work we consider display date, frequency, and synchronization.
With these animated semiological variables we can try to convey radioactive scintillation through a map. It’s possible to twinkle cartographic simbols into and out of existence, in a manner that cannot be done in a static graphic. I intend to apply scintillation to cartography, hence the term scintillocartography.
The realm of scintillocartography started, perhaps, in 2010, as an post-conference alcohol-induced dare, where a few fellow cartographers were discussing if it would be possible to apply the technology of glittery-looking animated GIFs of the 1990s to map images. And indeed it was: an image animation process to mimick glitter was applied to a limited number of map tiles (square images that make up web maps), and so TEH GLITTERMAP!!!1! was born, a comedy-by-excess way to reminisce the meme of 90s glittery webpages.
The second iteration of TEH GLITTERMAP!!!1! swapped the offline image processing for WebGL shaders. Instead of having to precalculate the glitter animation beforehand, it’s possible to tell a web browser to apply the scintillation to the map image in real time. The WebGL shader runs an edge detection algorithm (so that only pixels in areas of changing colour are affected), a colour space transformation (from red-green-blue to hue-saturation-value), and applies a pseudorandom variance to the brightness (value) of pixels.
It is worth noting that The Book Of Shaders by Patricio González Vivo has been instrumental in enabling the understanding and creation of WebGL shaders. It is also worth noting that while radioactive decay displays true randomness, it is not possible to achieve true randomness in computers without significant work. Computers can generate pseudorandom numbers easily - even though they’re not fit for applications where true randomness is required (such as cryptography), these look random enough to the human senses, specially when paired with numerical techniques to hide their patterns.
For the work in Nuclear Sessions I’ve used a 2017 dataset of radon potential, published by the Spanish Nuclear Safety Council. This highlights the geological potential of the terrain to build up radon gas, particularly in built-up basements with bad ventilation, and when certain types of stone are mined from quarries. The default visualization is a plain map with a 5-colour categorical scale:
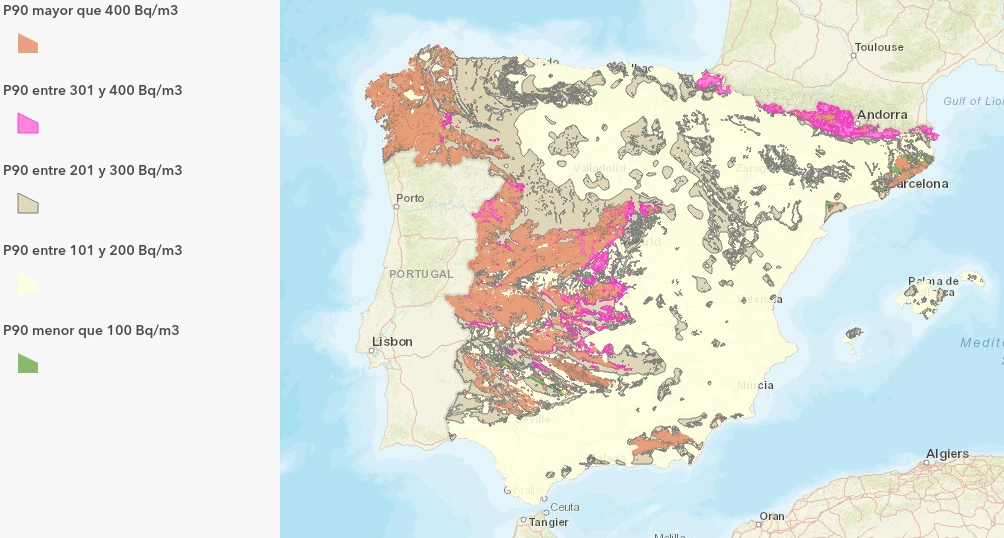
(Map of Radon Potential in Spain, CSN, 2017)
This dataset was selected purely on the basis of availability: it was the easiest (and first) geographic dataset regarding radiation to be found. The selection of dataset (and the discussion of which radiation-related datasets can or should be displayed) is out of the scope of this article. The intent is to give an overview of the technique, and to confirm (or deny) the hypotheses that scintillation in a map can convey radioactivity.
The prototype implementation relies on simple ideas: instead of drawing the polygons of the radon dataset as colours, they are drawn as a scalar field - meaning one invisible number per pixel. At a second pass, each pixel is turned white if the value of the field in that pixel is bigger than a (pseudo)random number. If the (pseudo)random number is bigger, then the pixel is discarded, which translates as being transparent and letting the background dark basemap to be seen.
In more technical OpenGL/WebGL terms: the first rendering pass renders the polygons into a framebuffer with a R32F texture as its colour attachment, and stores the numerical value associated to the radon risk. The second rendering pass uses that texture, as well as another R32F texture containing pregenerated (pseudo)random noise. For performance reasons, the (pseudo)random noise texture is reused, but a (pseudo)random offset is applied to its texel coordinates, on a per-frame basis.
The GLSL program used in the WebGL fragment shader is as follows:
void main() {

    // Fetch the value of the scalar field for this pixel
    float value = texture2D(uField, vUV).x;

    // Fetch the value of the pseudo-random number for this pixel
    // Note that uRNGOffset is set to a pseudorandom value at each rendering frame.
    float prob = texture2D(uTwinkleRNG, (vUV + uRNGoffset) / uRNGsize ).x;

    // If the value of the field is bigger than the pseudo-random number...
    if (value / uMaxIntensity > prob) {
        // ...then give the pixel the desired colour (in our case, white)...
        gl_FragColor = uColour;
    } else {
        // ...and if not, discard the pixel, leaving it transparent.
        discard;
    }
}
Since the result is animated, it cannot be properly conveyed in written form. Its appearance does resemble a dot density map, with higher values of the dataset variable (radon potential) displaying as higher density:
(Scintillating map, using data of CSN’s 2017 Map of Radon Potential in Spain)
The animated nature of the scintillating map cannot be shown in written form; and since I’m assuming the worst case that you’re reading this article printed on a dead tree (i.e. paper), these five still frames from a section of the map should illustrate that the scintillating pixels change every frame (i.e. 30 times per second):
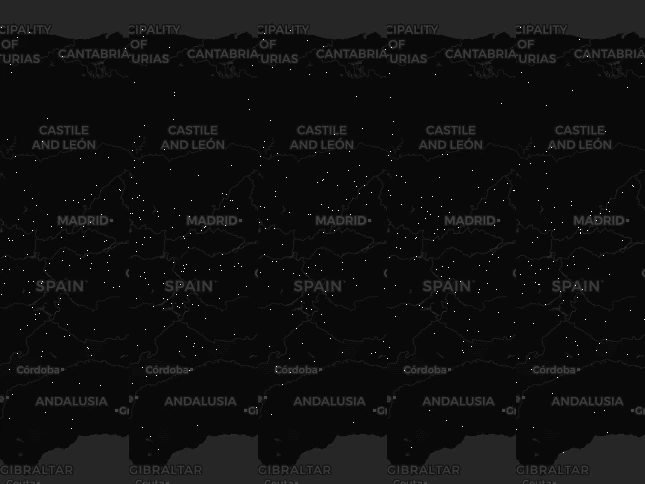
(Frames of scintillating map, using data of CSN’s 2017 Map of Radon Potential in Spain)
There is also a webpage with the scintillating map prototype, but beware that it can take a couple of minutes to load (due to an unbeknownst issue in the process of triangulating the dataset polygons).
Does this prototype of a scintillating map convey radioactivity? I think the answer is “yes, but not good enough”.
The (pseudo)random scintillation of the white dots feels good enough at conveying chaos and randomness, and also at conveying activity (as in radioactivity) and a bit of aggression: the data is not a clear definite graphic but an alive-looking amorphous thing; a noise that damages the image and prevents us from seeing (what we believe to be) the territory.
The varying probability of a pixel scintillating does work at conveying the relative values of the dataset. However, a linear increase in probability (which directly translates to density) doesn’t feel like a linear increase in the perceived value. The numerical values of the selected dataset (which vary from 1 to 5) are cubed (making them vary from 1 to 125).
The biggest shortcoming of this prototype is the absence of persistence. Ideally, the scintillation would persist in time for an duration similar to that of a cloud chamber trail (between half a second and two seconds), and not disappear on the next rendering frame. A graphical scintillation should, as well, come into existence abruptly but fade out smoothly.
Those changes should, hopefully improve the conveyance effects better. Unfortunately they are not trivial to achieve on the technical side: they would require either a third rendering pass (and another framebuffer to store the pixels currently scintillating and their remaining time), or the application of a Montecarlo algorithm out of the GPU before the first and second pass (to spawn the scintillations) plus an overhaul of the second rendering pass (which would just draw the scintillations instead of performing calculations on full-screen textures).